Monitoring Software Trending and Ad-Hoc Analysis Reports
 Trend Analysis Report |
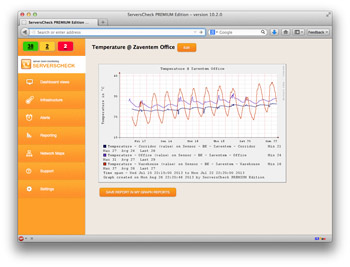
For each value based check, the software will automatically generate graphs and save them on the host running the software as PNG files. Graphs are created for the past 24 hours, week and month.
The graphing engine is built-upon the RRD Tool. The open source RRD project is widely used by many users and embedded in many applications such as Nagios or Cacti. This open source project has ServersCheck as its main sponsor for several years. The benefit of using RRD is that databases never grow in size and are ultrafast for querying plotting ad hoc graphs. Sometimes real-time graphs are not enough: you may want to narrow down for a specific time frame or you may want to compare values of different checks into one graph. This is what the trend analysis reporting feature has been built for: enabling you to simply create custom graphs in a very easy to use interface. Trend analysis reports can be created for a specific time range between 2 dates & times or for a dynamic time range. A dynamic time range is for the last X hours, days, weeks or months. Whenever you save a graph for a dynamic time range and then access it again, then the graph will be recreated for the specified interval. |